

India GDP

India GDP
The GDP of India with regards to purchasing power parity is approximately 4.463 trillion dollars, which places it in the 4th position in the world. With regards to official exchange rate its GDP is close to $1.843 trillion.
At the end of 2011 the real growth rate of India GDP was approximately 7.8 percent, which gives it the 15th rank from a global perspective. In 2010 this was almost 10.1% and in 2009 it was close to 6.8%.
The per capita (PPP) GDP of India is approximately 3700 US dollars, which places it in the 163rd position from a global perspective. In 2010 this figure stood at almost $3500 and in the previous year this was at $3200.
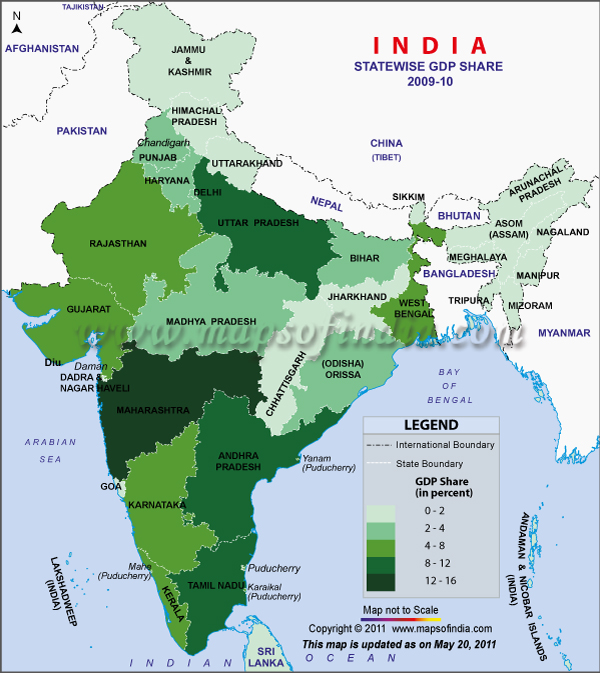
Sectoral Composition of India GDP
As per the figures available for 2011 fiscal, almost 52 percent of India’s GDP comes from the agricultural sector and the services sector is the second biggest contributor with 34 percent. The industrial sector contributes almost 14 percent of India’s GDP.
Agriculture and Other Allied Activities Contribution to GDP
India GDP 2012-13
HSBC, a leading global bank has stated that in 2012-13 fiscal India’s chronological and yearly growth will be a moderate one. It had previously stated that in the same period India’s GDP will grow by 7.5 percent but has now brought down the forecast to 6.2%. HSBC opines that in 2014 India will see a better growth rate of almost 7.4 percent – previously it had forecast 8.2 percent for the period.
Leif Eskesen, an economist with HSBC, has stated that the year has started off on a weak note and reforms in the supply sector have been rather slow. The global economy is also taking a lot more time than expected to recover and all this has led to revaluate their previous growth forecasts.
HSBC has also stated that there are plenty of difficulties in the Indian administration and domestic policies are in a paralyzed state. The bank feels that these factors will restrict the amount of investment being done in India and limit its economic progress in the immediate future. It feels that things can improve in the second part of the fiscal.
HSBC opines that in the present circumstances the RBI might feel forced to take a step and reduce the rates. The changes are likely to be made on June 18, 2012 and there could be a deduction of almost 25 basis points. This will happen in spite of the consistent inflation.
The bank also states that the rate at which demand is going up, there could be risk of further inflation. It has called for the economic structure to be reformed with greater efficiency and stressed that this needs to be done quickly.
India’s GDP statistics for the first three months of 2012 were not at par with expectations. During April the rate of industrial production was pretty unimpressive as well when compared on a year-on-year basis and to March 2012.
The fact that India has not been able to effect useful structural improvements has hampered its possible growth as well. In the final quarter the national economy grew at 6.1 percent and in the next quarter it came down to 5.3%, which is the lowest figure recorded after 2004.
However, inflation rate is still pretty high in India. In May 2012, the WPI inflation increased to 7.55 percent as opposed to 7.23% in April. At present the CPI inflation rate is more than 10 percent.
HSBC states that inflation rate can come down to certain extent owing to reduction in oil prices and moderate economic growth but the exchange rate is still weak and India’s overall economic capacity is somewhat restricted and all these factors can keep the inflation factor in play.
At the end of 2011 the real growth rate of India GDP was approximately 7.8 percent, which gives it the 15th rank from a global perspective. In 2010 this was almost 10.1% and in 2009 it was close to 6.8%.
The per capita (PPP) GDP of India is approximately 3700 US dollars, which places it in the 163rd position from a global perspective. In 2010 this figure stood at almost $3500 and in the previous year this was at $3200.
Sectoral Composition of India GDP
As per the figures available for 2011 fiscal, almost 52 percent of India’s GDP comes from the agricultural sector and the services sector is the second biggest contributor with 34 percent. The industrial sector contributes almost 14 percent of India’s GDP.
Agriculture and Other Allied Activities Contribution to GDP
| Year | 1st Quarter statistics in INR crores | 2nd Quarter statistics in INR crores | 3rd Quarter statistics in INR crores | 4th Quarter statistics in INR crores |
|---|---|---|---|---|
| 2004-05 | 135745 | 108879 | 172401 | 148401 |
| 2005-06 | 139404 | 113023 | 185750 | 156309 |
| 2006-07 | 144790 | 116947 | 193209 | 164245 |
| 2007-08 | 151336 | 122418 | 211649 | 169677 |
| 2008-09 | 154307 | 123389 | 204748 | 171675 |
| 2009-10 | 156740 | 126524 | 201853 | 177390 |
| 2010-11 | 161614 | 132668 | 224044 | 190778 |
| 2011-12 | 167548 | 136806 | 230359 | 193955 |
Mining and Quarrying Contribution to India GDP
| Year | 1st Quarter statistics in INR crores | 2nd Quarter statistics in INR crores | 3rd Quarter statistics in INR crores | 4th Quarter statistics in INR crores |
|---|---|---|---|---|
| 2004-05 | 20275 | 20067 | 21744 | 22943 |
| 2005-06 | 21110 | 19649 | 21745 | 23636 |
| 2006-07 | 22187 | 20901 | 23608 | 25882 |
| 2007-08 | 22391 | 21837 | 24620 | 27149 |
| 2008-09 | 22903 | 22125 | 25226 | 26989 |
| 2009-10 | 24616 | 23676 | 26582 | 29351 |
| 2010-11 | 26304 | 25398 | 28200 | 29520 |
| 2011-12 | 26251 | 24016 | 27403 | 30798 |
Manufacturing Contribution to India GDP
| Year | 1st Quarter statistics in INR crores | 2nd Quarter statistics in INR crores | 3rd Quarter statistics in INR crores | 4th Quarter statistics in INR crores |
|---|---|---|---|---|
| 2004-05 | 104208 | 116104 | 115718 | 122684 |
| 2005-06 | 117187 | 120670 | 126161 | 134992 |
| 2006-07 | 131954 | 137611 | 143788 | 157084 |
| 2007-08 | 148701 | 152128 | 158009 | 170214 |
| 2008-09 | 159042 | 162174 | 162114 | 172445 |
| 2009-10 | 167571 | 176550 | 180421 | 195187 |
| 2010-11 | 182895 | 187309 | 194435 | 209523 |
| 2011-12 | 196170 | 192790 | 195509 | 208999 |
Electricity, Gas and Water Supply Contribution to GDP
| Year | 1st Quarter statistics in INR crores | 2nd Quarter statistics in INR crores | 3rd Quarter statistics in INR crores | 4th Quarter statistics in INR crores |
|---|---|---|---|---|
| 2004-05 | 15369 | 15738 | 15671 | 15898 |
| 2005-06 | 16775 | 16448 | 16737 | 17161 |
| 2006-07 | 18054 | 18076 | 18561 | 18667 |
| 2007-08 | 19839 | 19679 | 19823 | 20084 |
| 2008-09 | 20687 | 20723 | 20823 | 21110 |
| 2009-10 | 21902 | 22175 | 21656 | 22533 |
| 2010-11 | 22541 | 22241 | 22480 | 23684 |
| 2011-12 | 24333 | 24424 | 24509 | 24839 |
Construction Contribution to GDP
| Year | 1st Quarter statistics in INR crores | 2nd Quarter statistics in INR crores | 3rd Quarter statistics in INR crores | 4th Quarter statistics in INR crores |
|---|---|---|---|---|
| 2004-05 | 54628 | 55320 | 57934 | 60973 |
| 2005-06 | 60665 | 60888 | 66693 | 69877 |
| 2006-07 | 67520 | 67183 | 72817 | 77278 |
| 2007-08 | 75338 | 76521 | 80352 | 83178 |
| 2008-09 | 82403 | 81673 | 80911 | 87571 |
| 2009-10 | 86032 | 86377 | 88339 | 94970 |
| 2010-11 | 93264 | 91557 | 96000 | 103378 |
| 2011-12 | 96539 | 97317 | 102376 | 108385 |
Trade, Hotel, Transport and Communications Contribution to India GDP
| Year | 1st Quarter statistics in INR crores | 2nd Quarter statistics in INR crores | 3rd Quarter statistics in INR crores | 4th Quarter statistics in INR crores |
|---|---|---|---|---|
| 2004-05 | 166536 | 173240 | 186971 | 200973 |
| 2005-06 | 189062 | 194038 | 208192 | 225403 |
| 2006-07 | 208411 | 217544 | 233919 | 251680 |
| 2007-08 | 234697 | 239445 | 258240 | 279431 |
| 2008-09 | 257700 | 261944 | 272156 | 295776 |
| 2009-10 | 279250 | 289020 | 301003 | 327941 |
| 2010-11 | 314546 | 319798 | 330117 | 365994 |
| 2011-12 | 357883 | 350263 | 363101 | 391527 |
Finance, Insurance, Real Estate and Business Services Contribution to GDP
| Year | 1st Quarter statistics in INR crores | 2nd Quarter statistics in INR crores | 3rd Quarter statistics in INR crores | 4th Quarter statistics in INR crores |
|---|---|---|---|---|
| 2004-05 | 105870 | 106130 | 110428 | 114744 |
| 2005-06 | 117760 | 119871 | 123364 | 131482 |
| 2006-07 | 133638 | 136440 | 141377 | 149923 |
| 2007-08 | 150540 | 153509 | 158429 | 165897 |
| 2008-09 | 168259 | 170953 | 177881 | 189619 |
| 2009-10 | 187106 | 189145 | 192558 | 201074 |
| 2010-11 | 205861 | 208815 | 214205 | 221114 |
| 2011-12 | 225165 | 229498 | 233758 | 243294 |
Community, Social and Personal Services Contribution to GDP
| Year | 1st Quarter statistics in INR crores | 2nd Quarter statistics in INR crores | 3rd Quarter statistics in INR crores | 4th Quarter statistics in INR crores |
|---|---|---|---|---|
| 2004-05 | 92414 | 100785 | 100215 | 117947 |
| 2005-06 | 98447 | 107946 | 107861 | 125904 |
| 2006-07 | 104767 | 111540 | 109432 | 126981 |
| 2007-08 | 109294 | 119536 | 115429 | 139569 |
| 2008-09 | 118993 | 131515 | 142649 | 152027 |
| 2009-10 | 134423 | 156838 | 154070 | 164765 |
| 2010-11 | 140384 | 163941 | 152857 | 180493 |
| 2011-12 | 144849 | 173869 | 162710 | 193275 |
India Gross Domestic Product at Factor Cost
| Year | 1st Quarter statistics in INR crores | 2nd Quarter statistics in INR crores | 3rd Quarter statistics in INR crores | 4th Quarter statistics in INR crores |
|---|---|---|---|---|
| 2004-05 | 695045 | 690774 | 781082 | 804564 |
| 2005-06 | 760412 | 752534 | 856505 | 884765 |
| 2006-07 | 831321 | 826243 | 936709 | 971738 |
| 2007-08 | 912135 | 905075 | 1026552 | 1055198 |
| 2008-09 | 984293 | 974496 | 1086507 | 1117212 |
| 2009-10 | 1057641 | 1070305 | 1166482 | 1213211 |
| 2010-11 | 1147409 | 1151725 | 1262338 | 1324484 |
| 2011-12 | 1238738 | 1228982 | 1339724 | 1395071 |
India GDP 2012-13
HSBC, a leading global bank has stated that in 2012-13 fiscal India’s chronological and yearly growth will be a moderate one. It had previously stated that in the same period India’s GDP will grow by 7.5 percent but has now brought down the forecast to 6.2%. HSBC opines that in 2014 India will see a better growth rate of almost 7.4 percent – previously it had forecast 8.2 percent for the period.
Leif Eskesen, an economist with HSBC, has stated that the year has started off on a weak note and reforms in the supply sector have been rather slow. The global economy is also taking a lot more time than expected to recover and all this has led to revaluate their previous growth forecasts.
HSBC has also stated that there are plenty of difficulties in the Indian administration and domestic policies are in a paralyzed state. The bank feels that these factors will restrict the amount of investment being done in India and limit its economic progress in the immediate future. It feels that things can improve in the second part of the fiscal.
HSBC opines that in the present circumstances the RBI might feel forced to take a step and reduce the rates. The changes are likely to be made on June 18, 2012 and there could be a deduction of almost 25 basis points. This will happen in spite of the consistent inflation.
The bank also states that the rate at which demand is going up, there could be risk of further inflation. It has called for the economic structure to be reformed with greater efficiency and stressed that this needs to be done quickly.
India’s GDP statistics for the first three months of 2012 were not at par with expectations. During April the rate of industrial production was pretty unimpressive as well when compared on a year-on-year basis and to March 2012.
The fact that India has not been able to effect useful structural improvements has hampered its possible growth as well. In the final quarter the national economy grew at 6.1 percent and in the next quarter it came down to 5.3%, which is the lowest figure recorded after 2004.
However, inflation rate is still pretty high in India. In May 2012, the WPI inflation increased to 7.55 percent as opposed to 7.23% in April. At present the CPI inflation rate is more than 10 percent.
HSBC states that inflation rate can come down to certain extent owing to reduction in oil prices and moderate economic growth but the exchange rate is still weak and India’s overall economic capacity is somewhat restricted and all these factors can keep the inflation factor in play.
For more information contact :
[email protected]
Disclaimer : All efforts have been made to make this image accurate. However Compare Infobase Limited and its directors do not own any responsibility for the correctness or authenticity of the same.
Last Updated on 06/18/2012Disclaimer : All efforts have been made to make this image accurate. However Compare Infobase Limited and its directors do not own any responsibility for the correctness or authenticity of the same.
